Category: Local Government

Creative Councils, Podnosh and a partnership in Brighton.

I’m delighted to say the the Brighton and Hove Council proposal to the Nesta Creative Councils challenge has made it to the final 17 long list of 137 applications.

Why so?  Well Podnosh is one of the partner organisations in the Brighton bid along with Demsoc and Public-i.

Creative councils:

ambition over the next two years is to work with a small group of pioneering local authorities across England and Wales and their partners to develop, implement and spread transformational new approaches to meeting some of the biggest medium and long-term challenges facing communities and local services.

Put simply our proposal will work on taking online and offline civic conversation and digitally connecting that into local public service decision making in a concrete way.

Thanks very much to Anthony Zacharzewski, Catherine Howe and Paul Brewer for getting things to this stage.

What next?  More work will be done on the final 17, with the hope of much more significant investment in 5 of the ideas.

The other 16 on the long list are:

  • Bristol
  • Cambridgeshire
  • Cornwall
  • Derbyshire
  • Essex
  • London Borough of Havering
  • London Borough of Islington
  • Leicester
  • Monmouthshire
  • Reading
  • Rossendale
  • Rotherham
  • Stoke on Trent
  • Westminster
  • Wigan
  • York

You can find and engage will all 137 ideas on simpl.

Open data, corporations, companies charities and some remarkable progress

Open Corporates - open data for making companies and corporates more transparent

Chris Taggart is one of the main energy bundles behind real practical progress in open data in the UK.  besides starting to scrape local government websites to create the the remarkable openlylocal, and  then casually setting up open charities (open data for information about charities) he has also been working on making information about business more freely available,

Open Corporates – he tells me – has reached quite a milestone:

A few hours ago, OpenCorporates tipped over the 20 million companies mark (with information on 40 million statutory filings too). Traffic is doubling roughly every 3 months, and all without VC backing.

We’re pretty pleased with all this, and couldn’t have done this without the open data community, who’ve helped with writing scrapers, giving advice and generally being there for us.
Open Corporates not only makes it easy for us to find out who owns what and how much profit they make, it allows us to groups companies, so we can see relationships begin to emerge. So for example you can help list the companies that form part of the Birmingham City Football club family of companies.
Why am I telling you this? Because it is important for us to recognise that individuals or groups of independent minded people are making significant progress is making our public life more Transparent.  they are no longer alone – they are starting to see some government help, in the UK, USA and the EU and charitable trusts are also growing their interest in how open data bolsters democracy.
But just for today I’d like to say congrats on 20 million companies – that’s is some achievement.

Stop pretending data visualisation is easy – bring distributed skills together

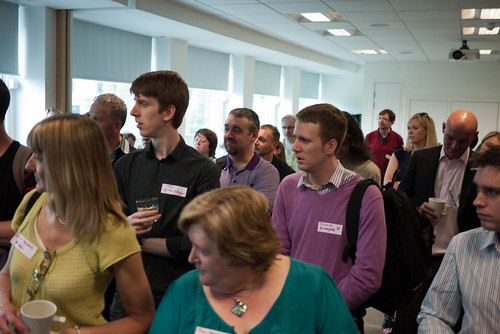
I spent a great day at LocalGovCamp in Birmingham last Saturday, an unconference for anyone interested in how social media and digital technology relates to local authorities and improving public services.

LocalGovCamp Birmingham 18 June 2011
Photo by Glenn Wood

Toby Blume, of Urban Forum and Paul Evans ran a session on data visualisation and visualising policy (more on that in this previous post).

Partway through the discussion, one particular issue really grabbed my attention. There was some frustration from some local authority officers about how difficult it is to actually make a visualisation or to communicate issues visually. It went something like this:

“This stuff is really hard. I want a tool that will let me put my data in and will give me a nice visualisation back.”

After a few responses – useful suggestions such as starting with Google Spreadsheets or Fusion Tables – the frustration with the steep learning curve came out, and Michael Grimes refocused the room with this nugget of sense:

“The process of creation [for a data visualisation] is important. It’s about how we communicate accurately with the information we have.”

And Michael got me thinking… do local authority officers expect making a data visualisation to be a straightforward process? Should it be easier? Are the available tools not serving those new to visualisation?

Or, and this is my thinking, there’s a false expectation that visualising data is easy. The JFDI attitude prevalent in other areas of digital tools for local government may have created false expectations on ease of access to visualisation.

Read more